
Most screens in shops, offices and waiting rooms show things that were true when someone last made a slide. The opening hours, a promotion that ended on Sunday, a welcome message. Meanwhile the numbers people actually look up at a screen for sit in other systems: which ticket is being served, how many orders are ready for pickup, how the team is doing against this month's target.
Live data templates close that gap. You design a slide once, and from then on your own system, a script or an AI agent sends it fresh data whenever something changes. The screen updates by itself and nobody needs to edit a slide.
You can try it on any plan, the free plan too. Every workspace includes one live data slide on Free and Starter. No limit from Professional up. This means you can connect a real data feed to a real screen before you spend anything.
How it works, in one minute
- A template is the design: HTML and CSS with placeholders like
{{nowServing}}where the values go. Write it yourself or have an agent design one for you. - A live data slide puts that template in a slideshow. It gets its own address that data is sent to.
- Your system pushes data to that address as a small JSON message, for example
{"nowServing":"A-142","room":"Room 2"}. Only the latest message is kept. - The screen shows it. The slide stays hidden until the first data arrives, so nobody sees an empty layout. If data stops coming, for example after closing time, the slide can hide itself again and come back with the next update.
There is no polling, no integration to build on our side and nothing to install at the screen. If your system can send an HTTP request, it can drive a sign. With HTML playback each update shows on the screen straight away; on a video stream it can take 1 or 2 minutes to appear.
Want the technical details first? Agents guide to the InfoSlides galaxy goes deeper into live data templates: how to design them, what data they take and how to push it.
What people use it for
Retail
- Click and collect: "Orders ready for pickup: 214, 217, 220" straight from the web shop, so customers stop asking at the till.
- Queues at the counter: the pharmacy, the deli or the phone repair desk calling the next number, with an estimated wait.
- Today's offer that really is today's: the price or stock count from the POS, like "Only 6 left" on the display next to the product.
- Staff screens in the back room: sales against today's target, updated after every transaction.
Offices
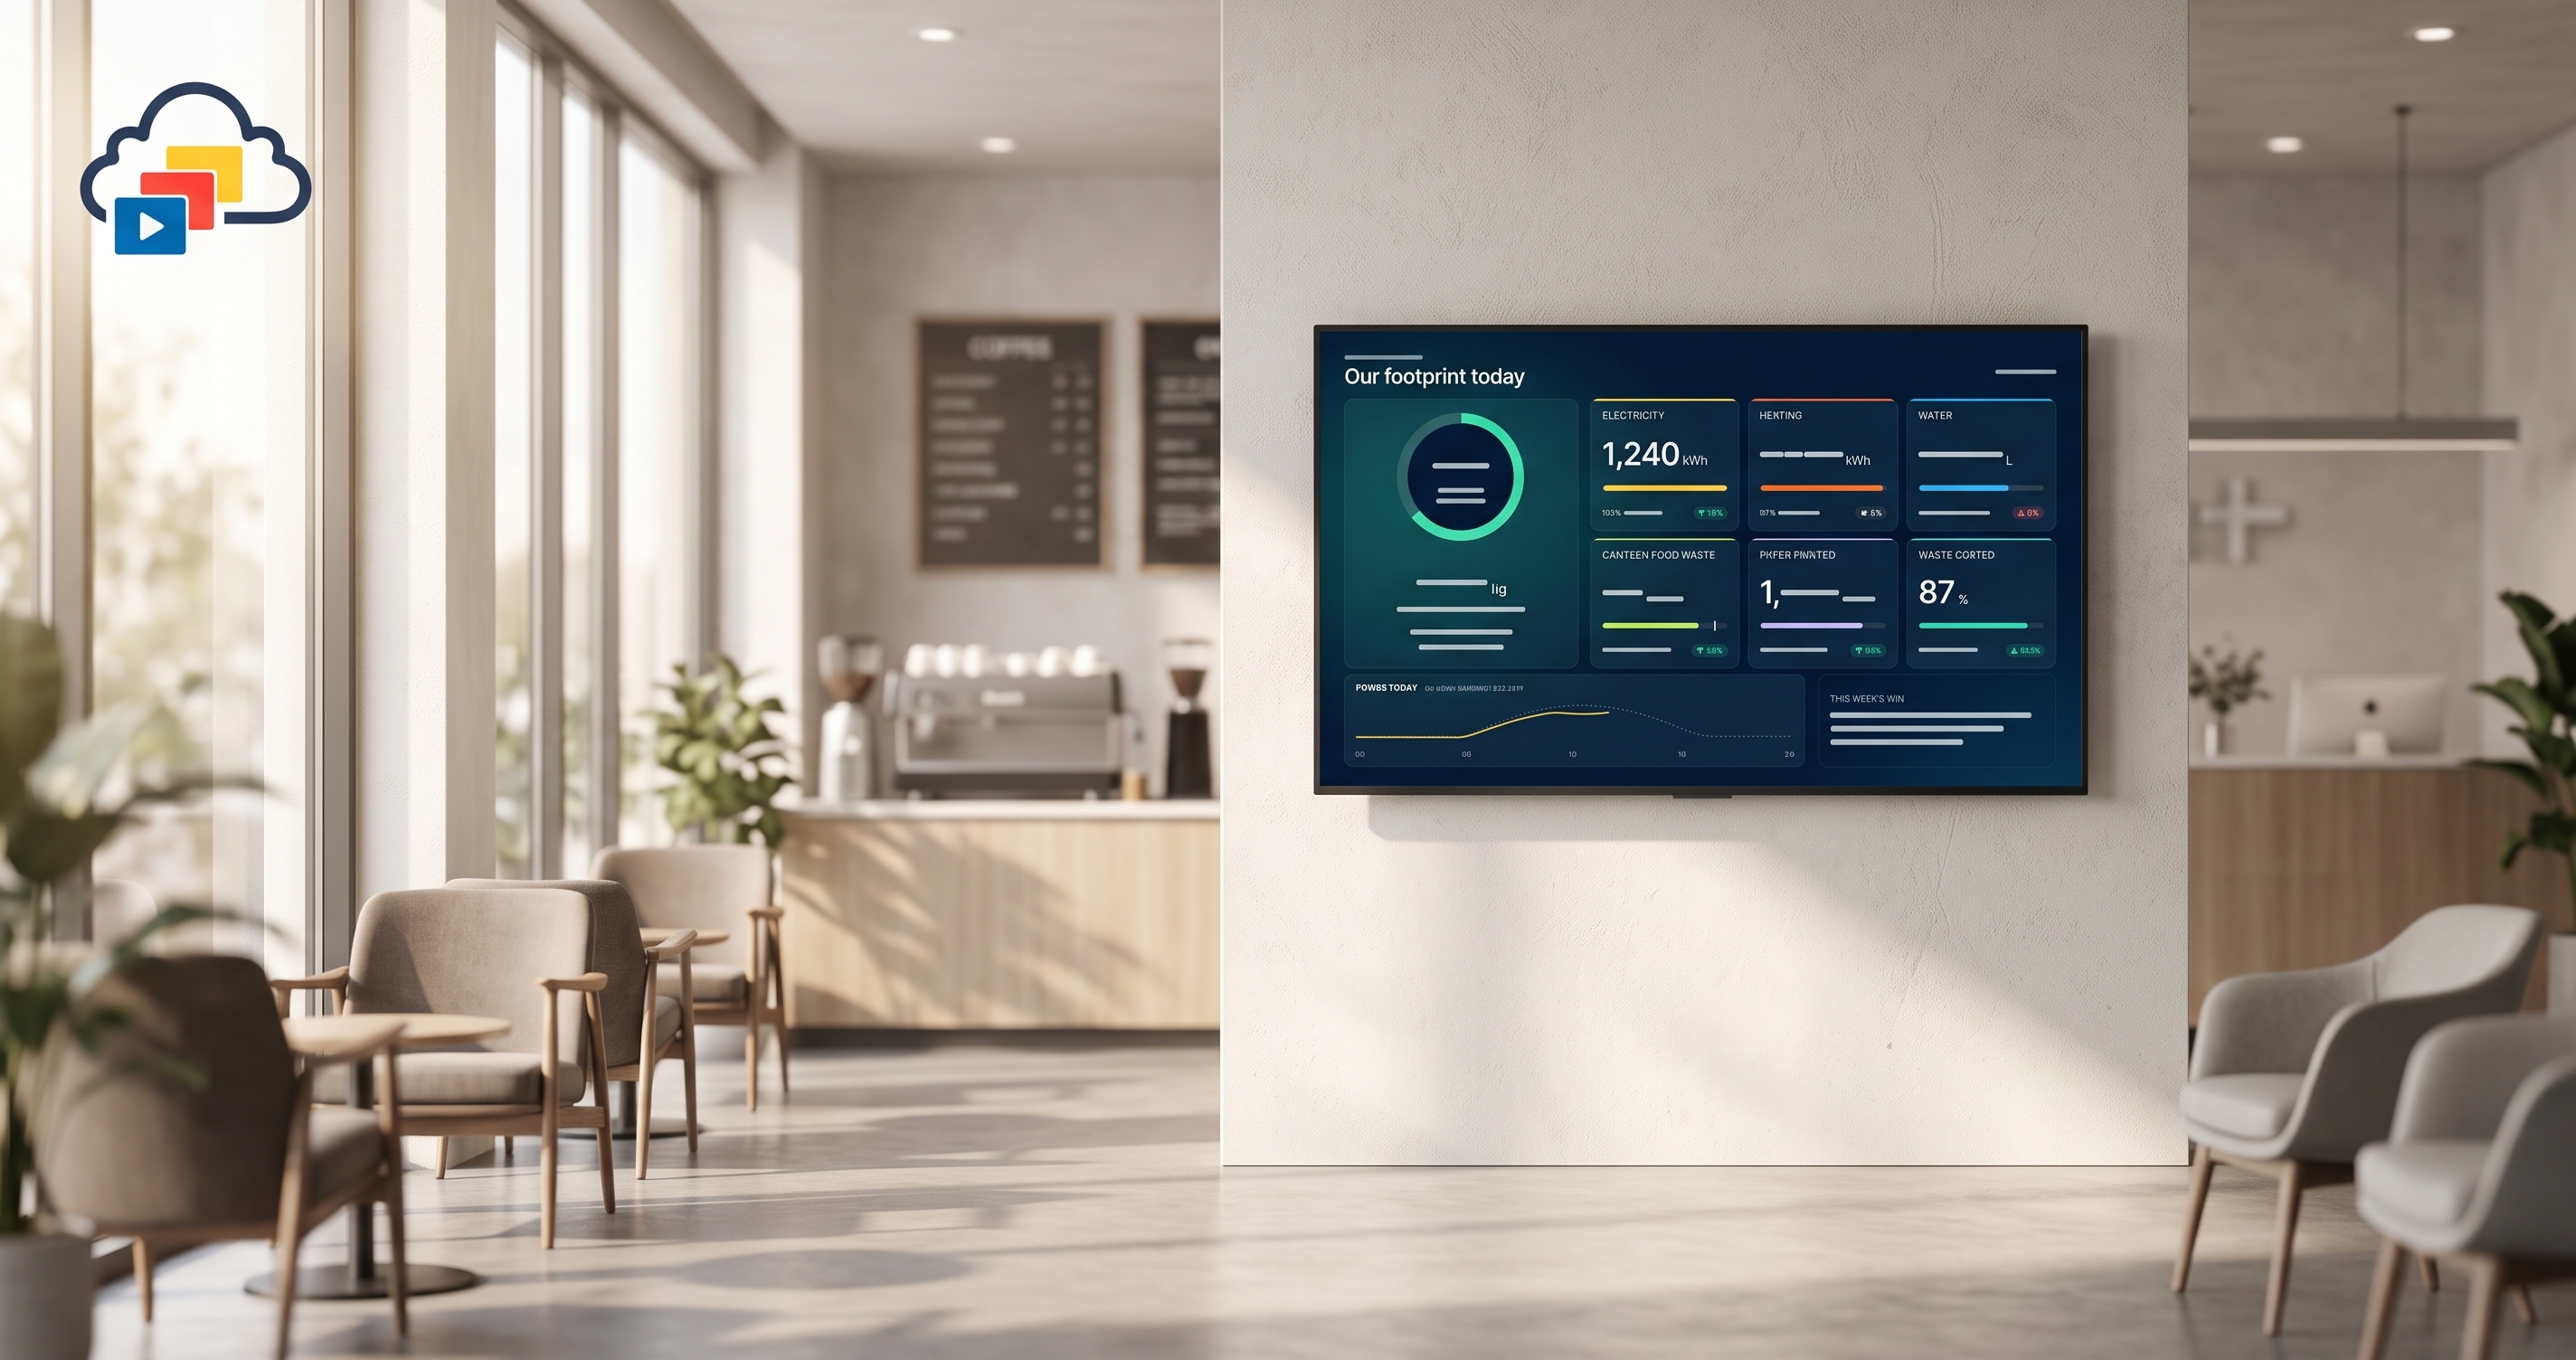
- Sustainability and energy: electricity, heating, water and food waste from the building's meters, shown in the lobby where visitors and staff see progress toward net zero.
- Team dashboards: open support tickets, deals closed this month or a release countdown on the screen by the coffee machine.
- Service status: a green board when everything runs, a clear message when something doesn't.
- Canteen: how many lunches are left and how full the room is right now.
Clinics, gyms, bars and the shop floor
- Clinics and service desks: who is being served, which room to go to and how long the wait is.
- Sports bars: scores from every match tonight on one screen, updated the moment a goal goes in.
- Gyms: class capacity and the leaderboard of this week's challenge.
- Production and warehouses: units produced this shift, orders waiting to ship and days without an accident.
Three ready-made examples
We built three live data templates to show what is possible. The screens below are running live, fed by simulated data, so you can watch them change.
Queue Board
A reception screen for a clinic: the ticket being served and the room to go to, the queue behind it, the state of each treatment room (busy, ready, being cleaned), plus a rotating care tip and an offer. The bottom of the slide is left free for the news ticker. It works the same way for a pharmacy, a service desk or a bank.
Impact Board
An office or school lobby screen that turns meter readings into something people understand: progress toward net zero, CO2 saved in trees and kilometres, electricity and heating with the renewable share, water against budget, food waste per meal and paper saved by double-sided printing. Every bar, ring and trend arrow is drawn from the data, so the screen stays honest.
Live Scores (Multi-Score Board)
Game night in a sports bar: up to eight matches on one screen, a highlight card for the latest goal, goals scored tonight and who is ahead. A score feed pushes each change, and fixtures that aren't playing simply don't show.
How it all comes together
Setting up a live data slide takes a few minutes in the dashboard. You end up with two things to hand to the system that has the data: an address and a key.
- Design the template. In the Template Editor, set the required content type to Push and write the layout in HTML and CSS, with a
{{placeholder}}wherever a value goes. Or ask an agent to design it for you. This article can be useful for both developers and agents to know the structure of the data schema. - Add a Push source. On the Sources page, add a source of type Push. If the data only matters while it is fresh, set Hide the slide when no data has arrived for (minutes), and the slide takes itself off the screen when the updates stop.
- Put the slide in a slideshow. Add a live data slide to the slideshow that plays on your screen, and pick your template and the Push source. It stays hidden until the first data arrives.
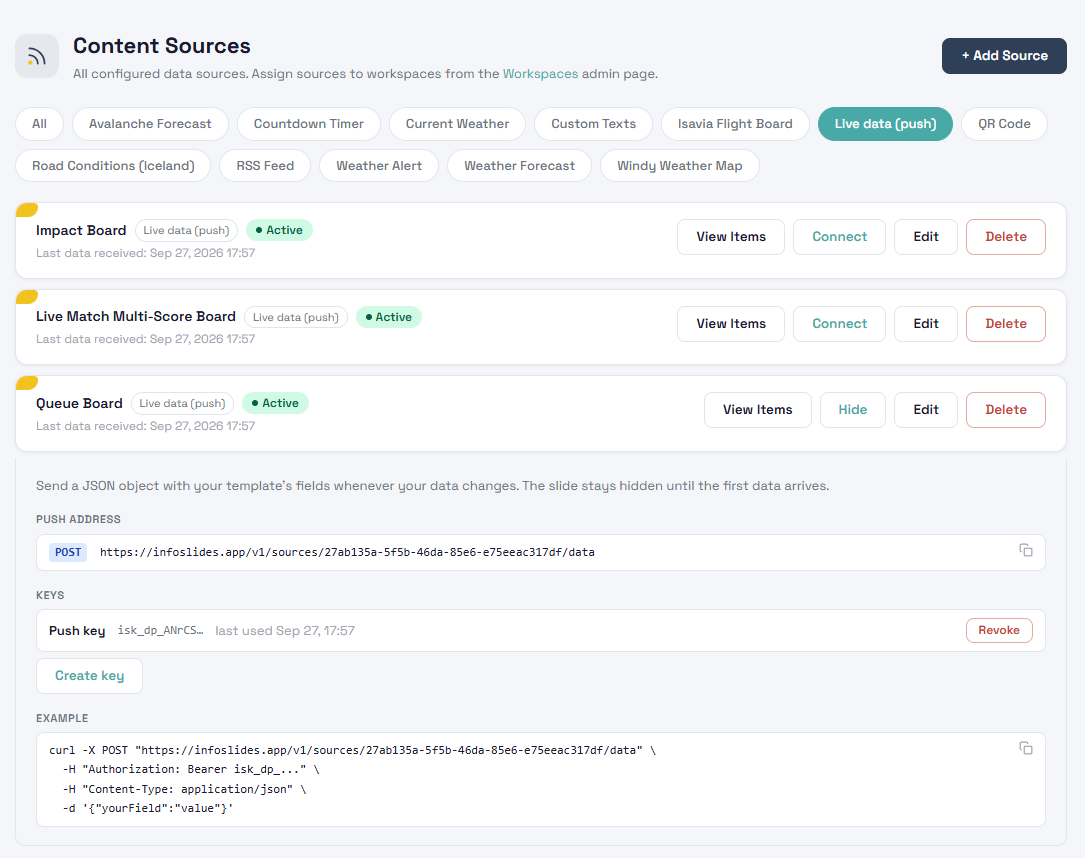
- Connect your system. Open the source's Connect panel. It shows the push address, and Create key makes a key for that one source. Copy the key straight away, because it is shown only once. The address and the key are all your system needs.
- Send the first update. The panel has a ready-made example request you can run as is. The source then shows when data last arrived, and the slide appears on the screen: straight away with HTML playback, within about a minute on a video stream.
The three boards above run exactly this way. A small program sends simulated data to each board's push address with its own key, the same way a queue system, a meter or a score feed would.
Prefer one key for several slides? Under Settings, API Keys, a Data Provider key can be bound to any live data slides you pick. Each slide in the list shows its template name, so the right one is easy to find.
On the free plan, the setup runs through an AI agent or the command-line tool, since the Sources page comes with the paid plans. On the free plan, an agent or the command-line tool sets it up for you. The steps are the same, and the next section shows how an agent does it.
Let an AI agent do the wiring
This is where it gets interesting. InfoSlides has an API, a command-line tool and an MCP server, so an AI agent like Claude or Cursor can do the whole job from one request. You could say:
Show our click-and-collect orders that are ready for pickup on the
screen by the entrance. The web shop can call a webhook when an
order is ready.
The agent designs a template, adds it to the slideshow on that screen, creates a key that can only send data to that one slide, and hands your web shop the address and key. From then on the shop pushes, and the screen follows.
An agent can also be the data source itself. It can read a spreadsheet, a calendar or a report every morning and push a summary to the lobby screen. Or it can sit in your team's chat and update the office dashboard when someone asks it to. No one opens a slide editor, and the signage just shows what is true.
Safe to hand over
The key for a live data slide can do exactly one thing: send data to that one slide. It can't read your slideshows, change your screens or reach anything else in your workspace. You can give it to a supplier's system or a script without worrying about it, and revoke it from the dashboard at any time.
For AI agents and developers: the short version
If you are an agent reading this to set up a live data slide, these are the steps. The full guide, with template design rules and more details on live data templates, is in Agents guide to the InfoSlides galaxy.
- Create a template with
POST /v1/templates: sendtitle,html,cssand"dataMode": "push". Use{{field}}placeholders, design for 1920 x 1080 withvh/vwunits, and don't use scripts or external stylesheets. - Add it to a slideshow with
POST /v1/slideshows/{id}/slides/dynamicand{"templateId": "...", "createPushKey": true}. The response contains thesourceIdand apushKey. The key is shown only once. - Push data with
POST /v1/sources/{sourceId}/data, using the push key as the bearer token and the whole JSON object as the body. Add?dryRun=trueto validate without storing. - Check it with
GET /v1/sources/{sourceId}(lastReceivedAt,isShowingData) andGET /v1/slides/{slideId}/preview.png.
curl -X POST "https://infoslides.app/v1/sources/{sourceId}/data" \
  -H "Authorization: Bearer isk_dp_..." \
  -H "Content-Type: application/json" \
  -d '{"nowServing":"A-142","room":"Room 2","waitMinutes":"12"}'
Push when something changes rather than on a timer. Send values already formatted the way they should read, and send states such as busy or ready instead of colours, so the template decides how they look.
Try it free
Every InfoSlides plan includes one live data slide, the free plan too, and on plans without AI Studio you can design its template in HTML and CSS. That is enough to put a real queue, meter or score on a real screen and see how it feels in your shop or office. When you want more, Professional and higher plans have no limit on live data slides.
Create your free workspace, pair a TV with the code on the screen, and let an agent send it your first number.